
📊 Statistics
Helping developers proactively prevent issues through real-time dashboards that track app overall health.
Introduction
While using an endpoint, you may become curious about your usage stats 🧐
For instance, you might be interested in the usage trend of your endpoints over the past week, or want to know the count of successful and failed requests. In the "Statistics" dashboard, you can find basic indicators and detailed logs that address these curiosities and provide insights into your usage patterns!
You can find the statistics menu on your project detail page. Please refer to the image below.
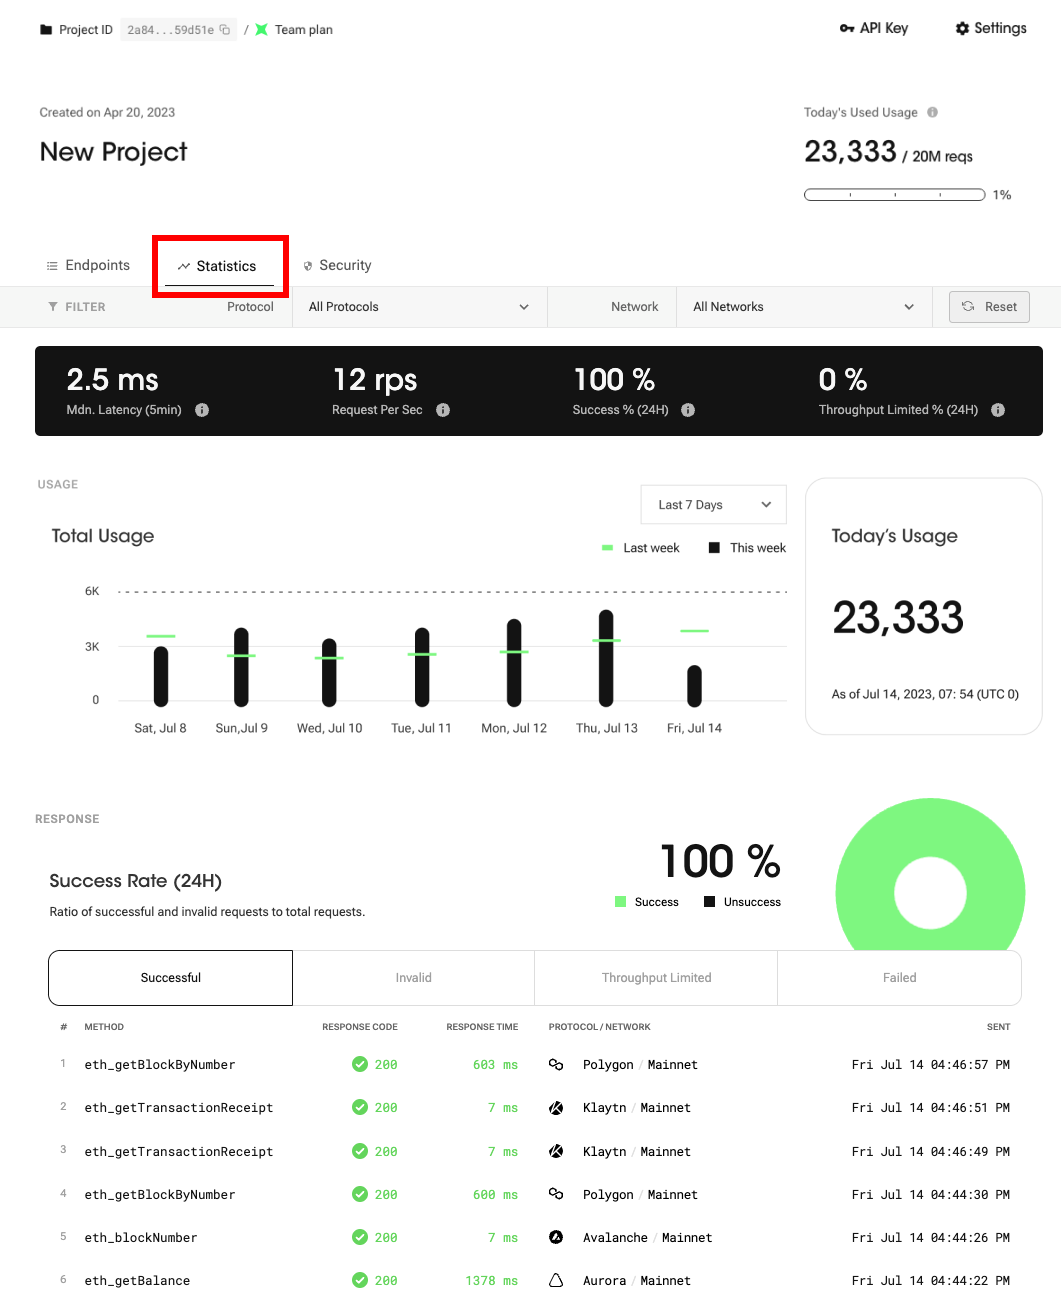
Statistics - Monitor your requests with powerful analytics!
This feature consists of five different elements, as listed below.
- 🎛 Control Center
- 📊 Usage Analytics
- 📈 Throughput Analytics
- 🔍 Command Analytics
- 🖥 Uptime Monitor
Control Center
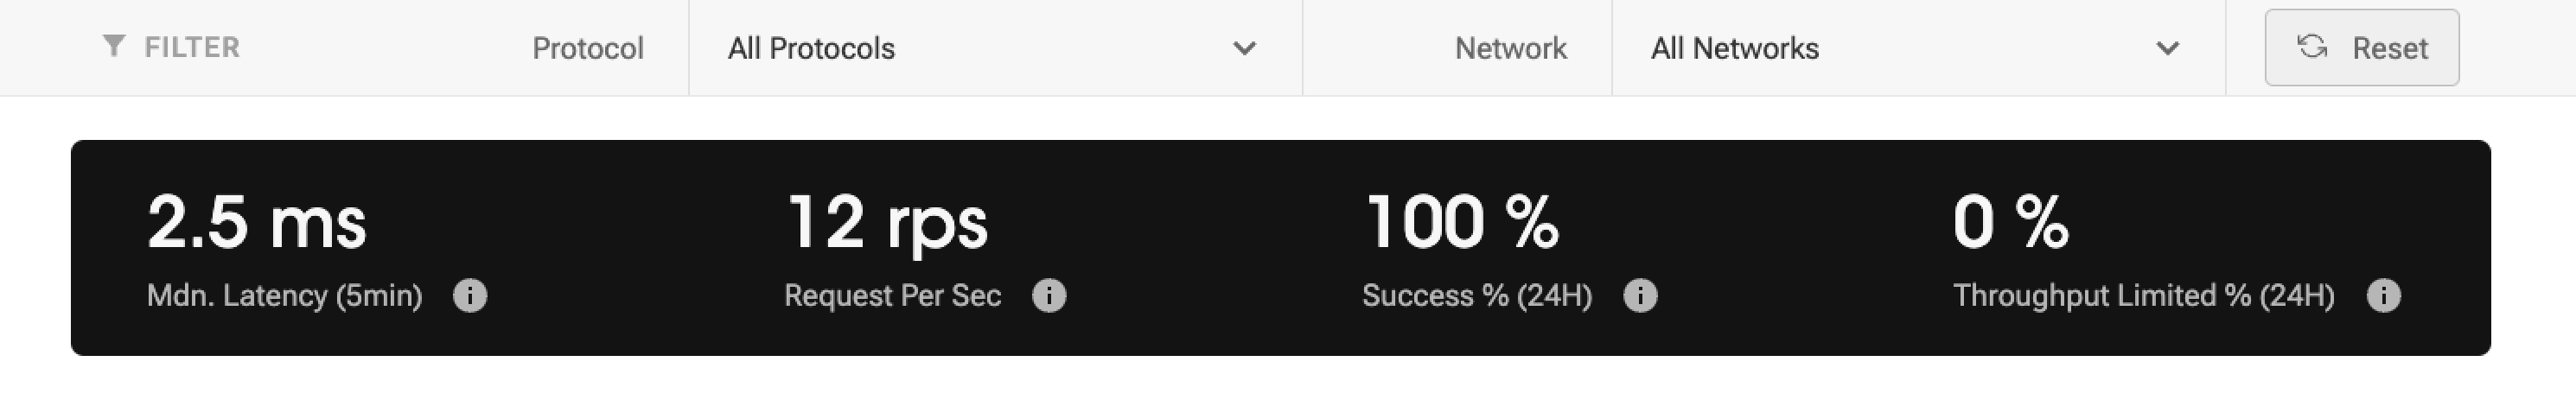
You can get instant metrics about the overall health of your project in one place. This part consists of [1] filters and [2] indicators.
Filters
You can select the protocol and network from the filter to refine the data displayed on the entire statistics page. By default, it will show the data for all your queries.
Indicators
Response Latency (Median, 5 min)
Response Latency refers to the median latency, or the middle value of latency observed over a specific period, in this case the last 5 minutes. Median latency helps provide insights into the general tendency of latency and can be useful in understanding the typical or representative latency experienced during that specific time interval.
FYI, 'Latency' is a metric used to measure the amount of time it takes for a server to respond to requests.
Requests per Second (1 min)
Requests per Second (RPS) is a metric used to measure the number of requests sent to nodes within a one-second timeframe. On the statistics dashboard, the RPS is calculated based on usage within the last 60 seconds. If you send a large number of requests simultaneously, your request may fail due to the concurrent throughput limit. Note that the throughput limit varies depending on your subscription plan. Go to compare plans →
Response Success Rate ( %, 24 hour)
Response Success Rate refers to the percentage of times that a request is sent and receives a response successfully. This includes both valid and invalid requests but excludes failed requests or those that have reached the throughput limit. The distinction is important because successful and invalid requests have both received a proper response, thereby consuming your daily request quota. On the other hand, failed requests or those reaching the throughput limit either failed to send or did not receive a response, and thus do not consume your daily request quota.
Throughput Limited Rate (%, 24 hour)
Throughput Limited Rate refers to the percentage of requests that are restricted due to the throughput specified in your subscribed plan. These blocked requests do not count towards your daily usage quota. The throughput limit varies depending on your subscription plan. To find the throughput limit for each subscription plan, please check the corresponding details here.
Usage Analytics
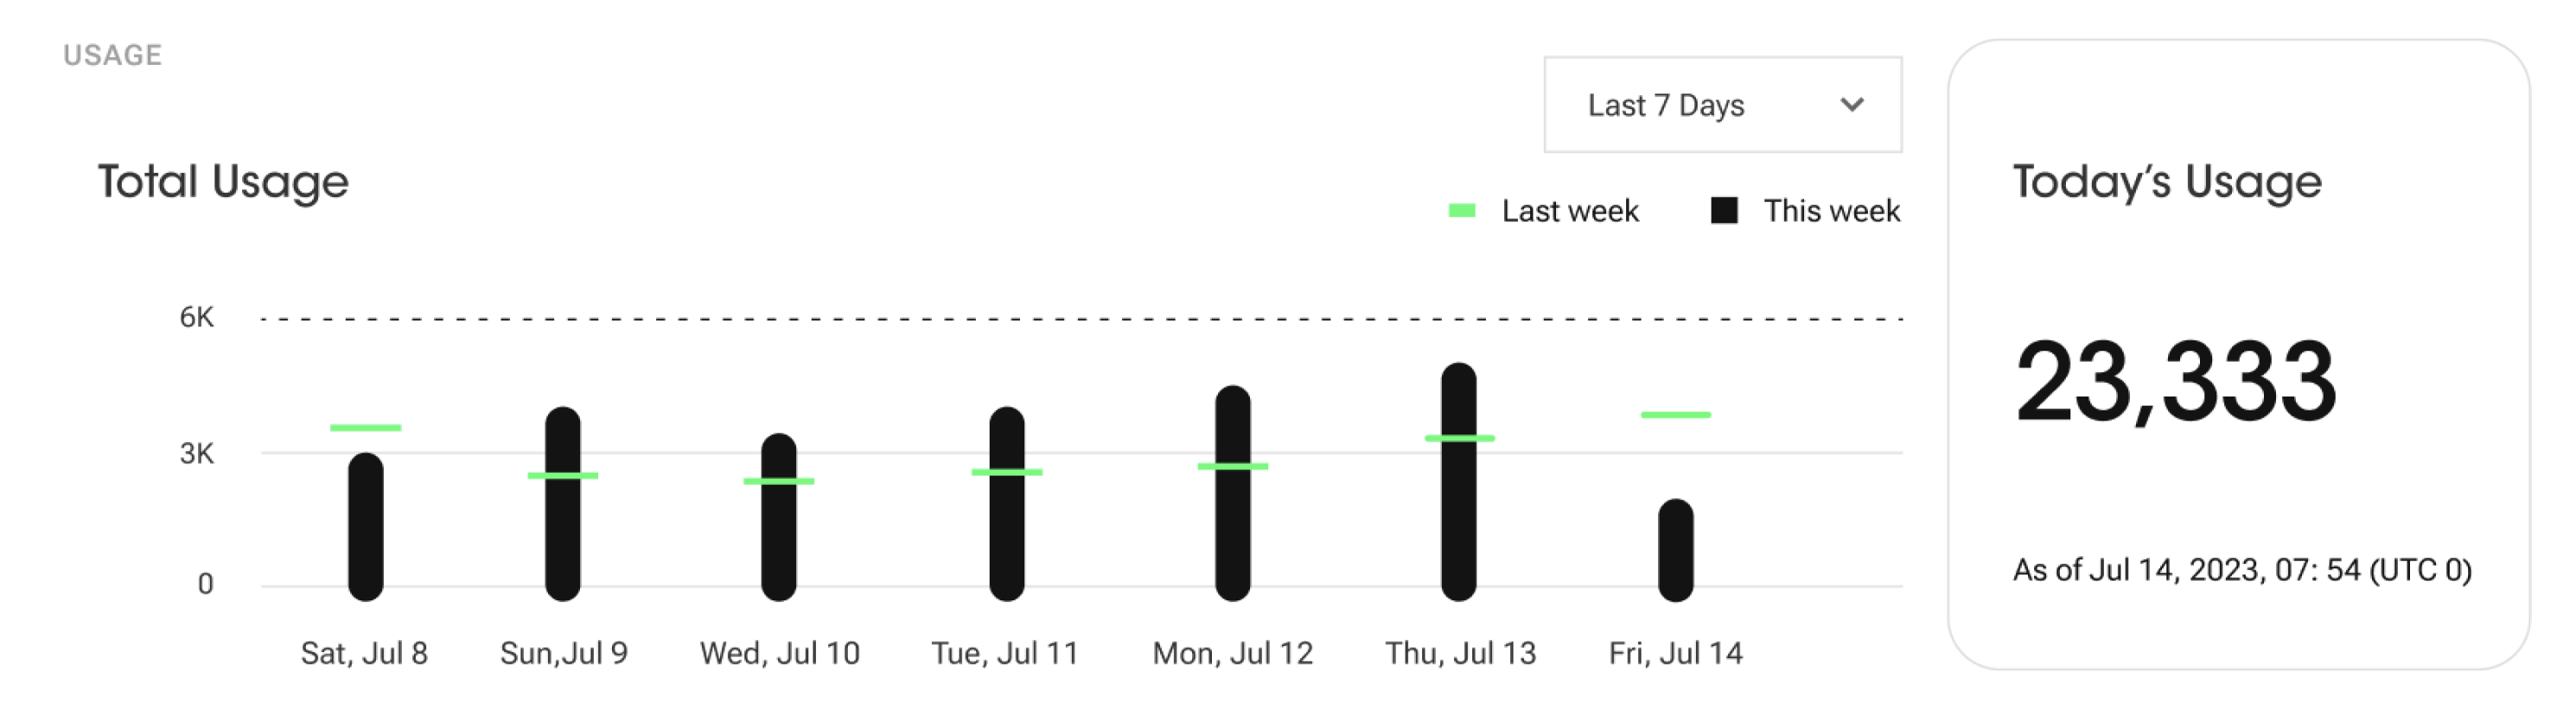
Chart
This divulges the overall usage of your project up to the current point in time, including all successful and invalid requests. The total usage graph can display trends over a period of either 7 days or 24 hours, with each time unit also reflecting the corresponding value from the previous cycle.
For example, a graph showing a 7-day trend would include values from the previous week, while a 24-hour graph would include the value from yesterday.
Today's Usage
"Today's Usage" displays the usage data from UTC 0:00 until the current time. This feature provides insights into the usage, activity, or consumption of a project during this period, allowing users to easily track and monitor their overall use.
Response Analytics
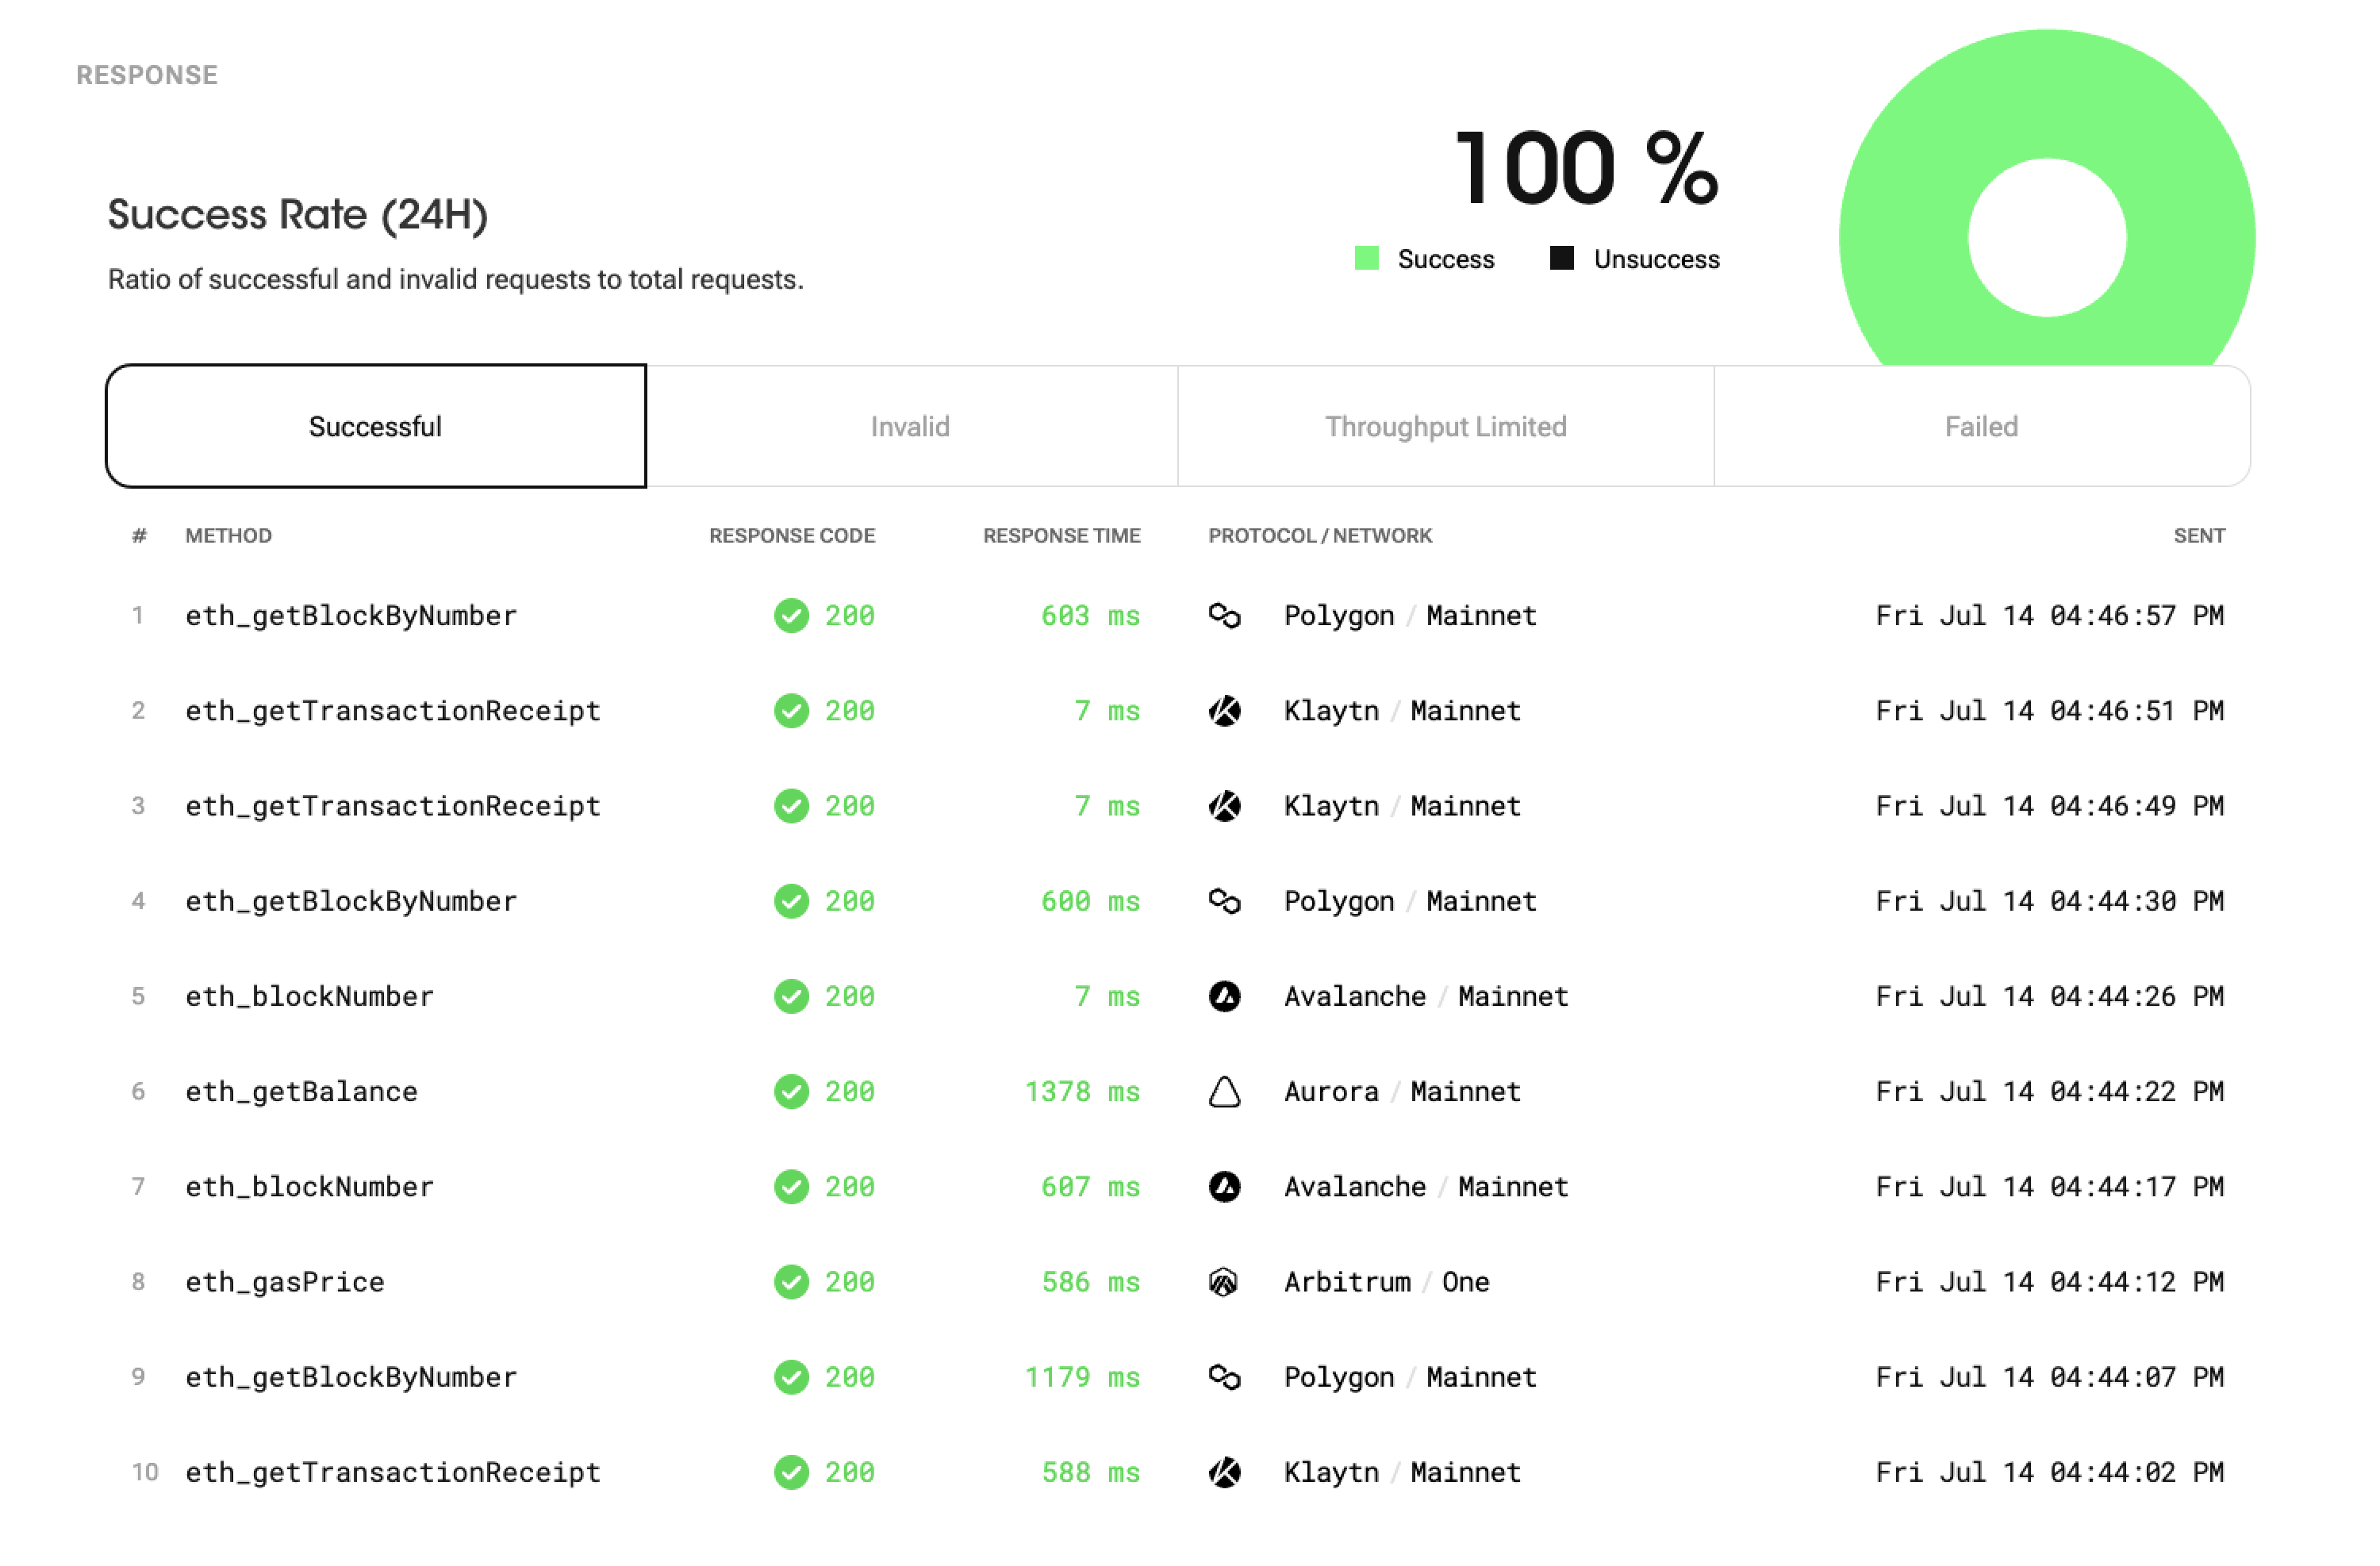
Success Rate
Success Rate includes successful and invalid requests. The reason why the success rate includes both successful and invalid requests is that both types can receive a proper response and consume the usage quota. Although invalid requests may not have achieved the desired outcome, they still receive a response and utilize the allocated usage quota. Hence both successful and invalid requests are included in the success rate provides a comprehensive measure of the overall request performance and resource consumption.
The success rate is calculated by dividing the number of both successful and invalid requests that receive proper "responses" by the total number of requests made.
Response Types
Your requests can return various types of responses. Here are detailed explanations of the response types:
- Successful: This response indicates a successful request. It means that the client received the desired results successfully. Successful responses signify normal service operations.
- Invalid: This response corresponds to an invalid request. It occurs when the client sends an invalid or malformed request. Invalid responses indicate errors in the client's request.
- Throughput Limited: This response is generated when the request is restricted due to throughput limitations. It indicates that your service sent too many request in a certain time period. Throughput Limited responses display a "429" response code and do not consume the daily usage quota.
- Failed: This response indicates a request that couldn't be sent. It occurs when the server encounters an internal error or an unexpected issue, resulting in failure to handle the request. Failed responses signify errors or issues within the service. Failed responses display a "500" response code and do not consume the daily usage quota.
Throughput Analytics
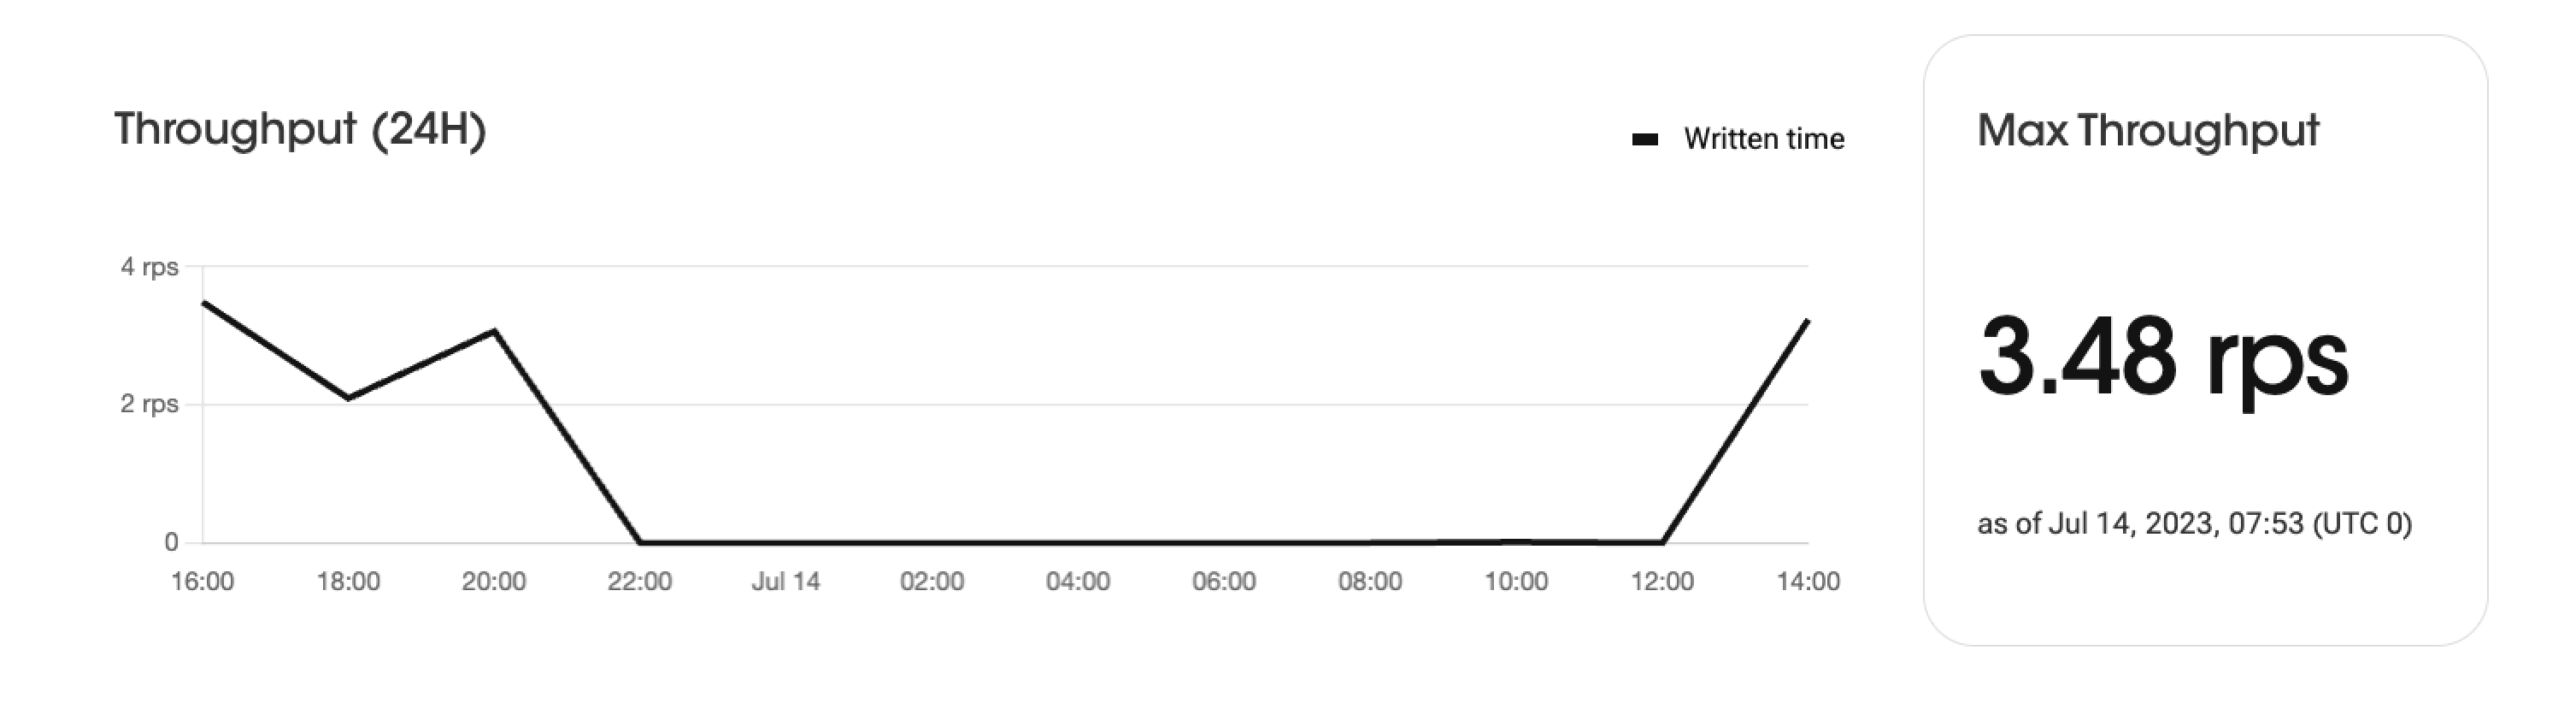
Chart
The throughput graph displays the request processing amount over a 24-hour period, categorized by time intervals. It visually represents the trends in request volumes during specific time periods. The graph shows the number of requests over time, enabling the analysis of peak times and variations in daily usage pattern.
Max Throughput
The "Max Throughput" indicates the highest number of requests per second (RPS) recorded during a 24-hour period.
Command Analytics
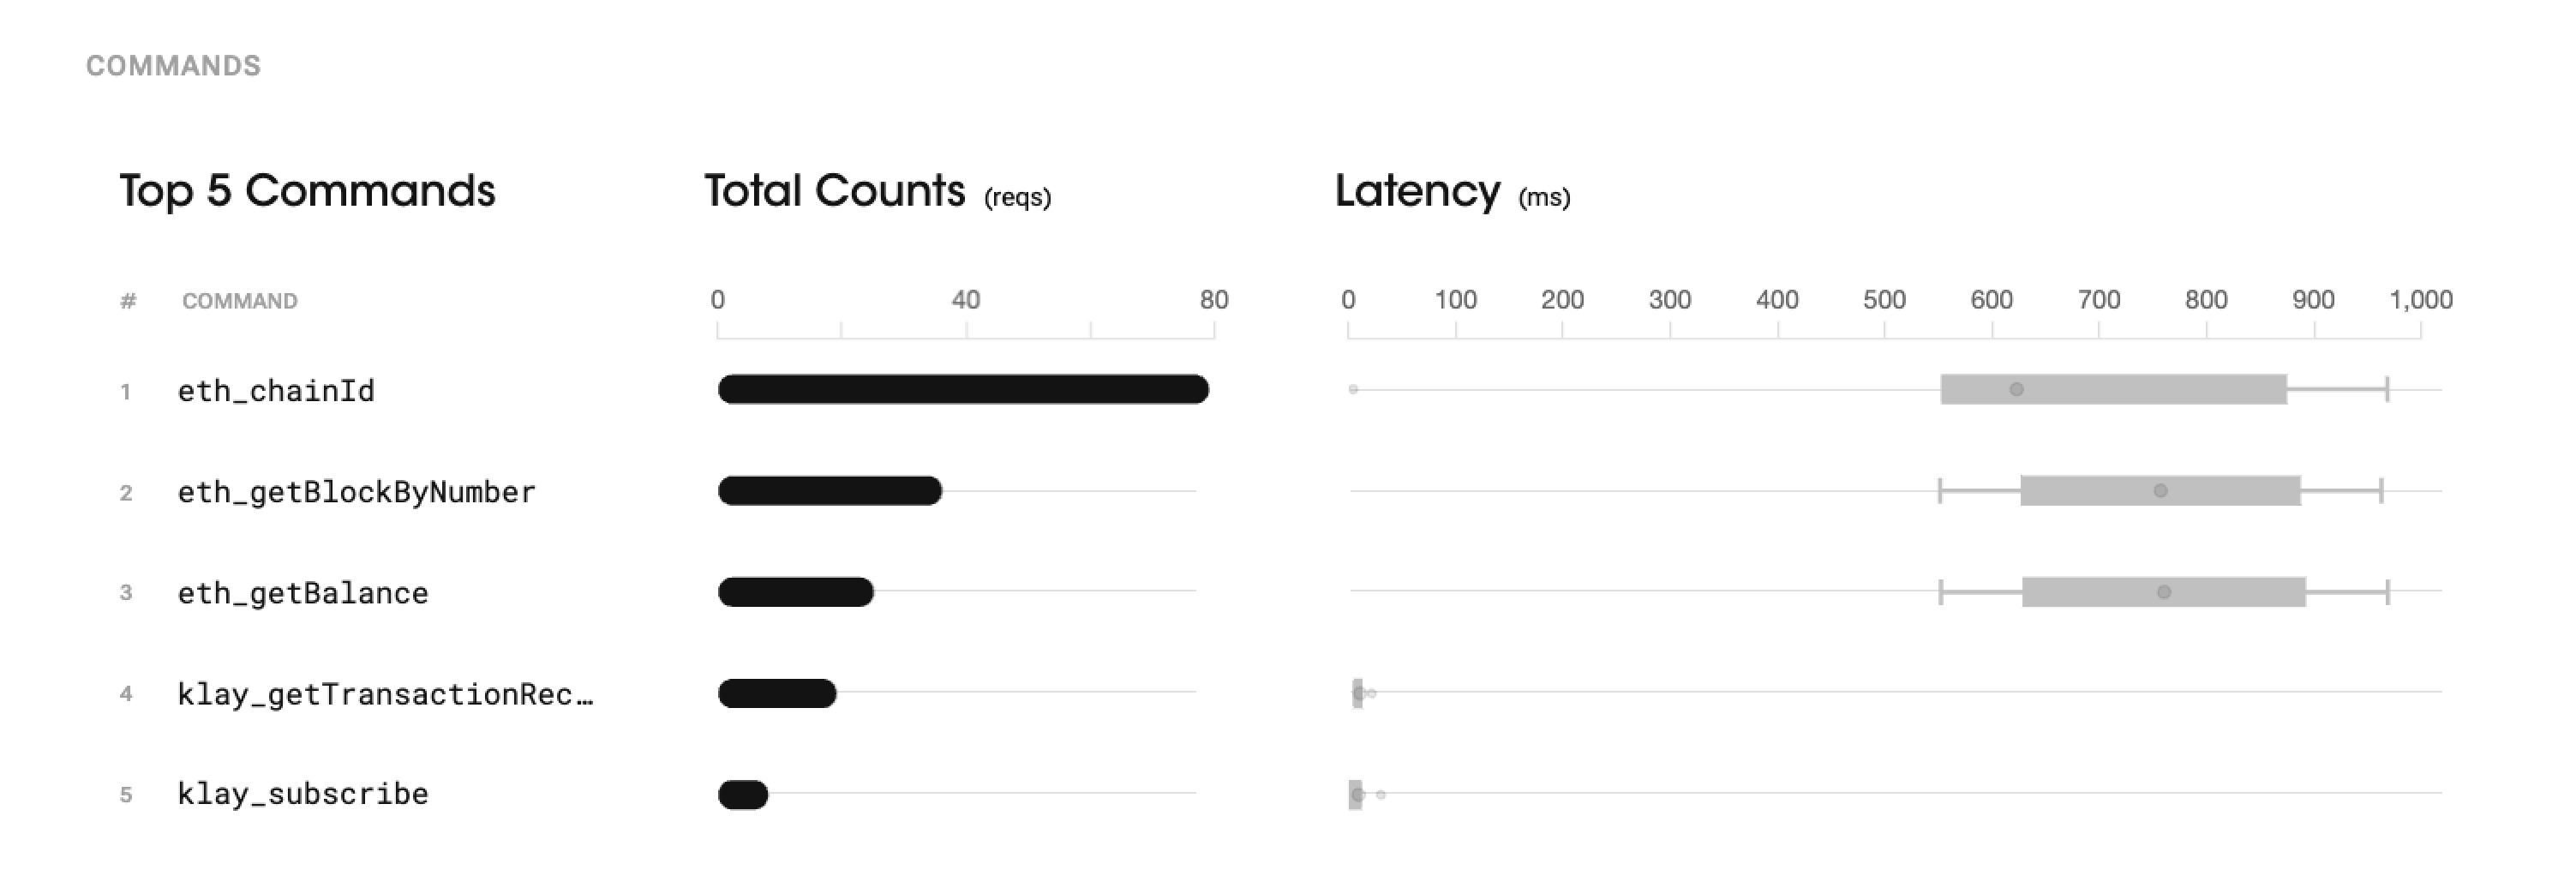
In the "Command" section, you can find the top 5 most frequently used commands based on a 24-hour period. It shows the number of times each command was used and their respective median latency. This information helps identify the most commonly used commands, providing insights into the service's core functionalities and user usage patterns. This section also provides insights into their performance based on the median latency, allowing for further analysis and performance optimization if needed.
The whisker chart, used to visualize the median latency, represents a distribution of response times for that particular command.
The chart displays a box that represents the distribution of response times. The box's boundaries represent the lower quartile (Q1) and upper quartile (Q3), indicating the range within which the majority of response times fall. The dot inside the box represents the median latency, which is the middle value of the response times.(When you hover the mouse over the box, it will display the exact median value.)
Additionally, "whiskers" extend from the box to show the minimum (1%) and maximum (99%) response times; the chart does not display outliers, unlike the standard box plot. These whiskers provide insights into the fastest and slowest response times observed for a given command.
Overall, the whisker chart helps analyze the distribution of response times for a specific command, showcasing the range, median, and outliers to gain a better understanding of the performance characteristics and variability of the command's response times.
Learn more about box-whisker plots here.
Uptime Monitor
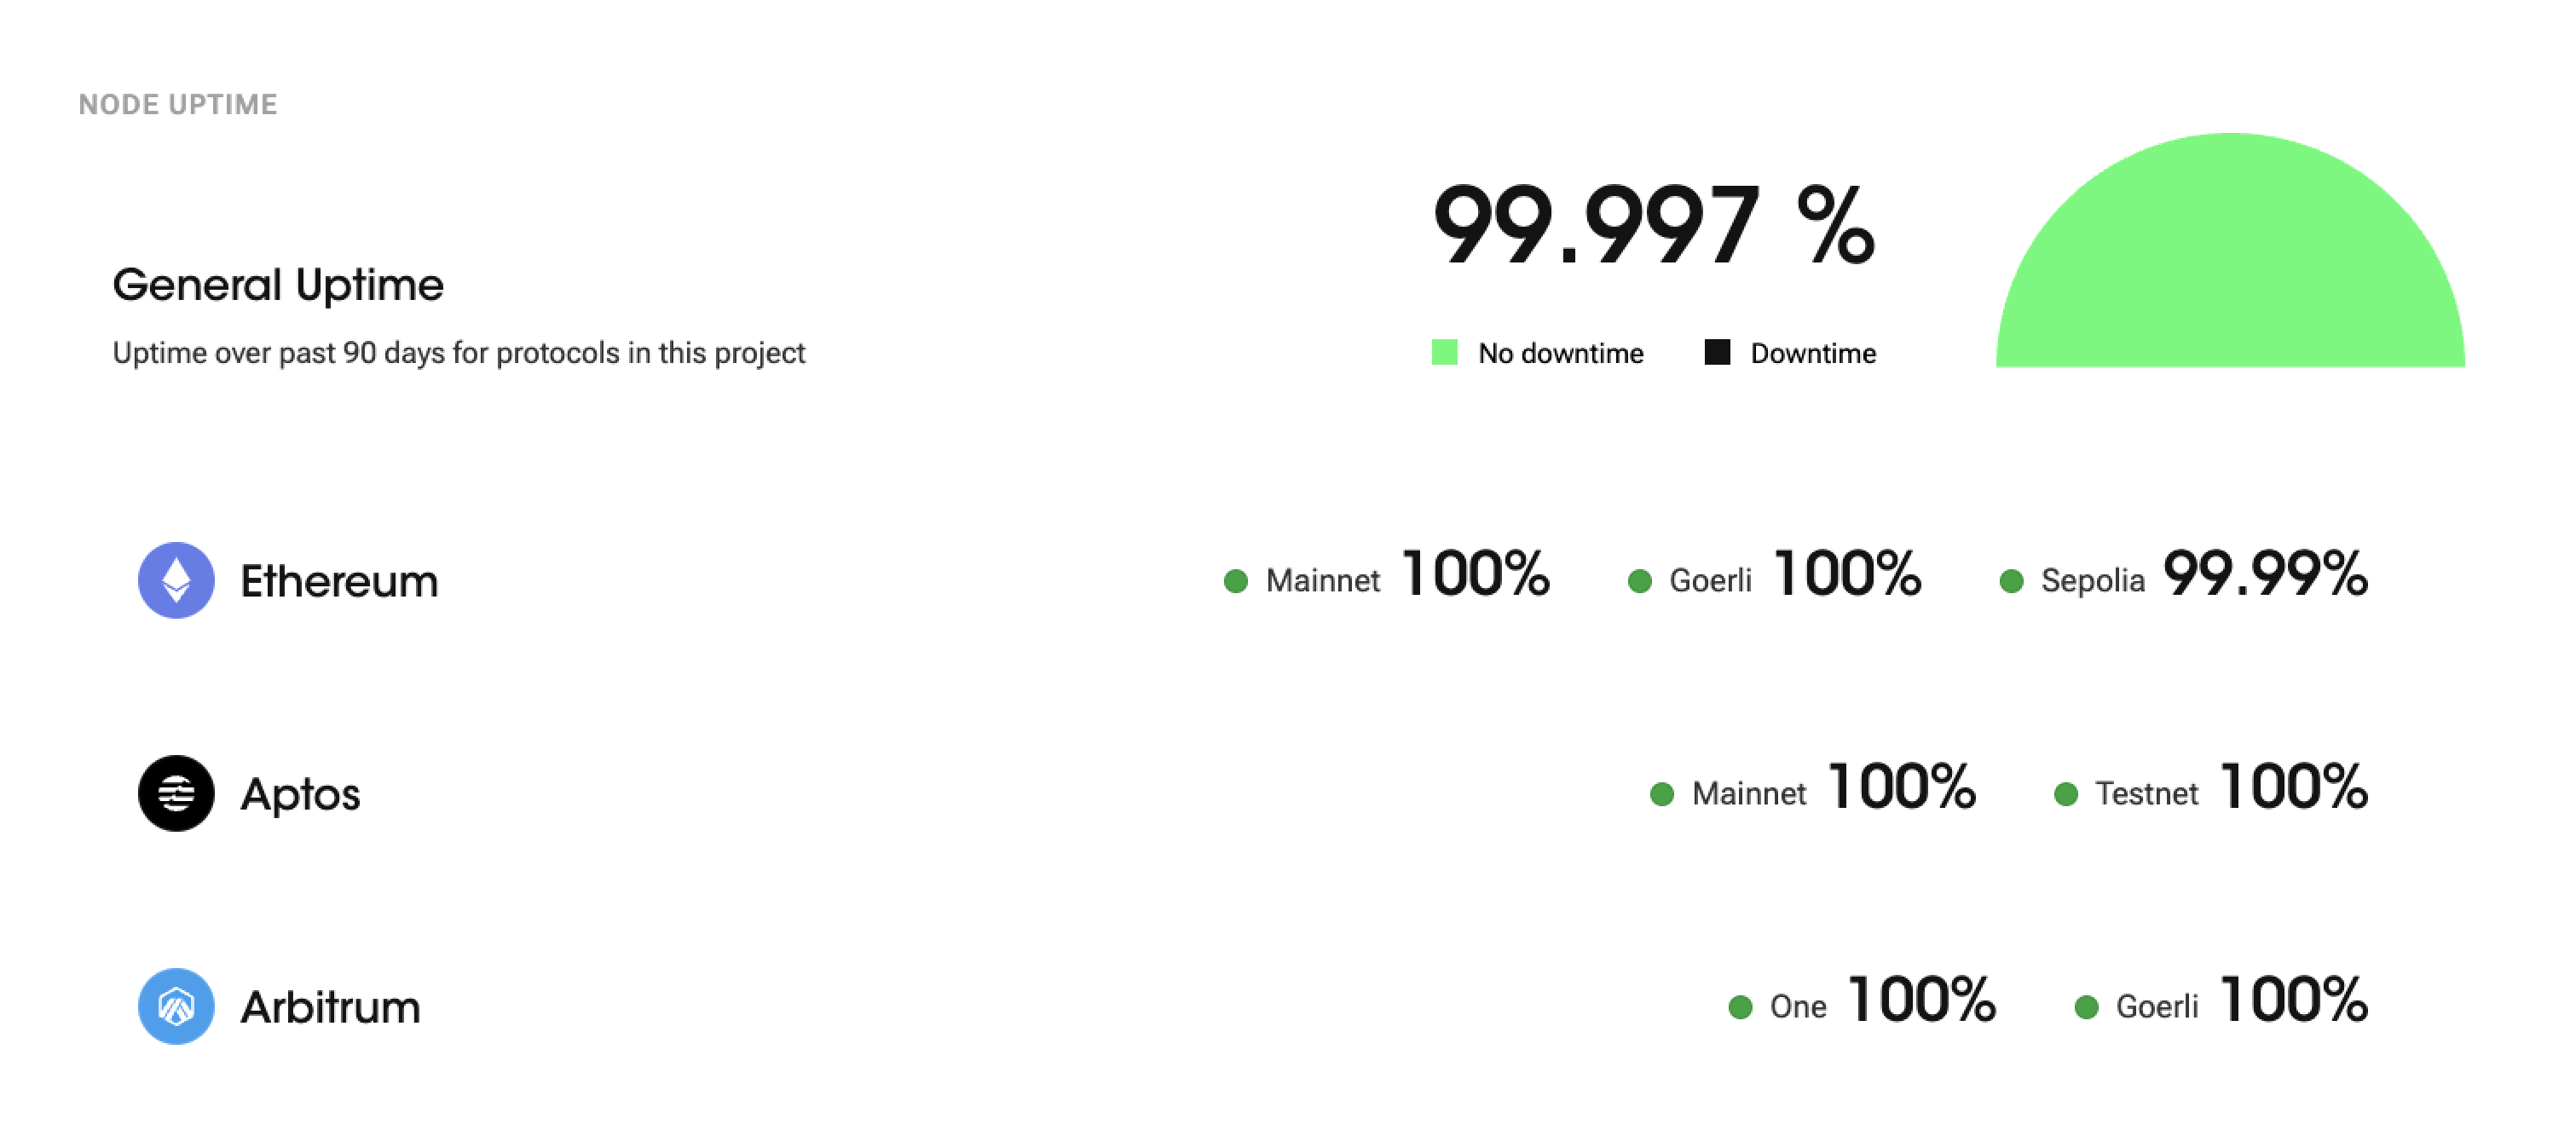
Node uptime is a crucial metric in blockchain networks as it indicates the reliability and availability of the node. It measures the continuous period during which the node is connected to the blockchain network and functioning properly.
99.9% node uptime means that the node has operated without any interruptions or issues for 99.9% of the total operating time. The percentage is calculated by dividing the total uptime (time without interruptions) by the total operating time and then multiplying that by 100.
General Uptime
"General Uptime" refers to the uptime of all protocols in this project over the past 90 days. It represents the total amount of time the protocols have been operational for without any interruptions or downtime during the specified 90-day period.
Updated about 1 year ago